Car-oriented sprawl increases driving and GHGs in greater Montreal
December 4, 2019 │By Steve Winkelman (Green Resilience Strategies),
James DeWeese & Ahmed El-Geneidy (McGill School of Urban Planning)
People living on the island of Montreal drive much less than those living off-island. This comes as no surprise, but now we have some real numbers. Our new analysis reveals that off-islanders drive 75% more kilometers than on-islanders: 34 km vs 19 km per average weekday. And that’s just the average. 35% of off-islanders drive twice as many km per day as on-islanders, and 18% drive three times as much. And people in the most travel-efficient Montreal neighbourhoods (e.g., Outremont, the Plateau, Westmount) drive only 12 km on a typical weekday – about one-third of the off-island average and one-sixth of the most travel-intensive areas. Figure 1 presents household-level travel data; the on-island average is 32 km/day, off-island is 55 km/day, and the regional average is 40 km/day.
Figure 1. Vehicle Kilometers Traveled per Household in the Montreal Region (weekday, 2013)

Source: J. DeWeese, based on 2013 Montreal metropolitan origin-destination survey.
The differences reflect planning priorities that run counter to some of our most important environmental and social goals. And they have profound implications for our ability to meet our short- and long-term climate objectives.
Why are we seeing these differences?
In a forthcoming paper, two of us (DeWeese and El-Geneidy) analyze in some detail the factors that influence whether and how much people drive in Montreal. Using the most recent publicly available version of the region’s most comprehensive travel-behaviour survey (2013 origin-destination survey), we look at how the influence of a host of socio-demographic and environmental characteristics change depending on travel purposes.[1] (It will be interesting to see how the 2018 edition differs, but it’s still under review).
A key factor that we consider is “accessibility,” a measure of how easy it is to reach a variety of destination types (e.g., jobs, shopping, services), which is often measured in terms of the number of opportunities that can be accessed in a given travel time. Accessibility can be measured on different scales (regional, local) and by different modes of travel (e.g., public transit, driving, walking). We find that both regional transit accessibility and local pedestrian accessibility (e.g., Walk Score) impact total levels of driving (varying by type of trip). In other words, when destinations are closer together, when people can use public transit to get across the region, or can walk to local destinations, they tend to drive less (normalizing for demographic and other factors).
The lower levels of driving we see in Montreal’s denser core are consistent with a vast academic literature on how urban form and land use (density, mix of uses, regional location, walkability, transit accessibility, etc.) impact levels of driving (e.g., Ewing et al, 2008; Ewing & Cervero, 2017; Handy, 2017; Litman, 2019): transit-oriented development (TOD) and “smart growth” can reduce driving by 20-50%.
Figure 2. TOD is disruptive urban technology – it can cut driving in half.

Image: Yuri Suzuki: ”Tube Map Radio” http://yurisuzuki.com/archive/works/tube-map-radio/
There’s still much more we don’t know about the manners in which public investments in transportation infrastructure shape people’s everyday travel choices. For that reason, researchers at McGill University’s School of Urban Planning have launched a major study of how transport projects affect travel behaviour, public health and individual well-being (www.mobility-montreal.ca).
Answering these questions is urgent. Suburban sprawl in the Montreal region has been accelerating since the 1950s (Nazarnia et al, 2015). From 2006-2016, 84% of population growth in the greater Montreal region occurred in suburban[2] areas (Gordon et al, 2018), with average growth on-island of 4.7% and 21.1% off-island from 2006 to 2016 (Marotte 2018). On the island of Montreal, 76% of growth from 2006-2016 was in core and transit areas, while off-island 93% of growth was in auto-oriented suburbs[3] and exurban[4] areas. In addition, 60% of regional jobs created between 2008 and 2013 occurred off island.[5]
“For all the new condos that are built in the centre of Montreal,
it’s nine times as much being built in areas like this – way out.”
– Dr. David Gordon, Queens University
There are multiple reasons why Montrealers choose to move off island. Certainly some people want more access to larger houses and yards. But housing affordability is also a key driver: the median house price on-island is 48% higher than off-island ($505,000 vs $340,000). Thus, many people seek more distant suburban locations to find housing they can afford, a phenomenon referred to as “Drive Until you Qualify.” But savings in housing costs can be offset by increased transportation costs in suburban areas, which can be range from 30 - 300% higher than central- and transit-oriented areas (Salon 2014, per figure 9 in Litman, 2019). According to the Canada Mortgage and Housing Corporation, people who moved from Montreal to the North Shore saved $650 per month in mortgage payments but faced increasing commuting costs of $270 per month (CMHC 2019). They may have realized a monetary cost savings but are paying for it in time – and society as a whole is paying for it via increased GHG emissions, air and noise pollution, traffic congestion, loss of farmland, and wetlands, etc.
In the Greater Toronto Area, 81% of home buyers would prefer walkable, transit-friendly neighbourhoods, but they can’t afford it (RBC & Pembina, 2014). From a basic economics perspective, the market under-supplies walkable, transit-oriented development (TOD): when demand is high and supply is low, price goes up (Levine & Frank , 2007). And this pent-up demand is growing (RBC & Pembina, Smart Growth America 2019), with walkable TOD housing commanding higher prices (Cortright 2019) – making them less affordable.
Another reason people opt to live in suburban and exurban locations is to be closer to nature. But the negative impact of sprawl on open space and agricultural land in the Montreal region is staggering: 149 square kilometers were lost between the mid-1990s and mid-2000s – that’s 70 times the size of Parc du Mont-Royal, equivalent to one-third of the land on the Island of Montreal.
Impacts for Greenhouse Gas Emissions?
As the footprint of regional development increases so does our carbon footprint. With the majority of regional growth occurring in remote, car-oriented areas – where people drive 75% more km each day – their transportation carbon footprint will also be about 75% higher.[6] While regional population grew 5% from 2008-2013, the car fleet increased twice as much (11%) and the number of car trips during the morning peak increased three times as much – by 15% (O-D 2013). And while there was a 10% increase in public transit and walk trips, the modal share of car trips increased from 60% to 62%.
In a recent survey from the Environics Institute, 37% of Quebeckers see the environment and climate change as the number one problem facing Canada (as opposed to 14% who see economic issues as the top concern[7]). So, we care about the climate, and recognize that we need deep cuts in GHG emissions, but we remain blind to an important cause of GHG emissions. Policies, planning and development decisions that support car-oriented sprawl (road expansions, exurban subdivisions, strip malls, lack of sidewalks, free parking, etc.) are like building invisible little coal plants all over the region.
Figure 3. Car-oriented sprawl is like building invisible little coal plants all over the region.

Map source: David Gordon, Queen’s University: CanadianSuburbs.ca Coal plant image source: Buena Buena from the Noun Project

But Quebec aims to cut GHGs to 20% less than 1990 levels by 2020, 37.5% < 1990 by 2030 and 80-95% < 1990 by 2050. And Montreal has pledged to reduce its GHGs to 55% < 1990 by 2030. The IPCC calls for even deeper cuts in global GHGs to reach net-zero around 2050 and limit warming to 1.5 °C to avoid the worst impacts of climate change. In 2016, Quebec GHGs were 9% < 1990. So we have some serious work to do to bend that curve quickly enough (Figure 5).
Figure 5. Quebec GHG Emissions and Target (1990 – 2050)
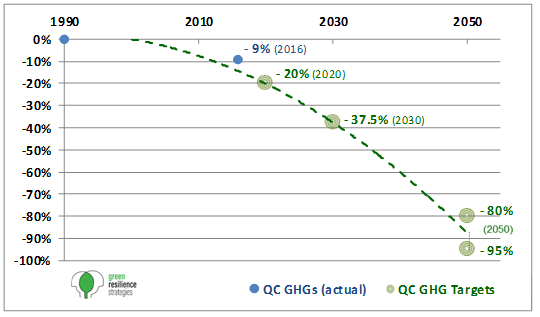
Source: S. Winkelman, actual emissions based on MELCC data.
Won’t electric vehicles solve the problem?
It depends which problem you aim to solve. If we’re focused solely on GHG reduction, then the combination of EVs and low-carbon electricity will eventually get us much of the way there. Especially in Quebec with very-low-carbon hydroelectricity and lower per-capita levels of driving (Shenstone-Harris, 2015). But it will take time and significant effort for EVs to dominate the fleet. And if we want to progress on a broader set of economic, environmental, social and health priorities, then EVs alone won’t suffice.[9] Let’s explore these points a bit further.
EVs currently represent 0.6% of the vehicle fleet in Quebec and about 2.2% of sales. After decades of regulation and incentives EV sales in California have reached 5.5% of new car sales. Bloomberg forecasts that EVs will make up 57% of global sales by 2040 as battery costs continue their steep decline. Canadian Federal goals call for Zero Emission Vehicles to make up 30% of light-duty vehicle sales by 2030 and 100% by 2040. But it can take 20 years for a new technology to ramp up to 90% of the vehicle fleet (Keith et al, 2019).
Norway’s high economic and tax incentives (and high incomes) have already pushed EVs to more than 50% of new vehicle sales. Are Canada and Quebec ready to aggressively strengthen regulations and increase incentives to increase EV sales? For any such major investment to reduce GHGs, a variety of alternatives should be analyzed to determine the best mix of investments (EVs, public transit, active transport, etc.) to maximize economic, social and environmental benefits. We also must consider the impact of a massive scale up of EVs on the available global supply of rare-earth metals such as cobalt and lithium and other metals (even as Propulsion Quebec considers tapping the province’s lithium reserves).
The amount of driving in Canada is projected to grow another 25% by 2050 (Canadian Energy Outlook). And if automated vehicles are a significant part of the future vehicle fleet, they could increase driving by 15% to 100% – or more – depending on the proportion of trips that are shared (Stephens et al, 2016, UCS, 2019).
As noted above, walkable, transit-oriented development can cut driving by 20-50% or more. And there are numerous economic, environmental and social benefits from smart growth and TOD strategies for individuals, governments and businesses. Benefits include time savings, travel cost savings, lower infrastructure costs, reduced health care costs, fewer pedestrian deaths, increased retail sales and higher returns on investment (e.g., Kooshian & Winkelman, 2011; Litman, 2019). A wider variety of housing choices also gives people the ability to stay rooted in neighbourhoods as they age. And a smaller land footprint can help preserve ecological habitat, rural landscapes and protect local food production. Finally compact communities with diverse travel options and high multi-modal accessibility are more resilient to shocks from extreme weather events, power outages and other disruptions.
It’s not either/or, it’s all-of-the-above.
With very little time to minimize the catastrophic impacts of climate change, we need an all-of-the-above approach. We need more renewable energy, a higher proportion of EVs and we must drive less. In an earlier blog, Avoiding Clean Congestion. Green tech isn’t enough, we need to drive less, I (Winkelman) illustrate that more EVs, renewable electricity and higher fuel economy are essential, but not enough for the US to meet 2030 GHG goals (summary video animation). And we’d still be stuck with all the problems associated with car-oriented development. In the framework of “Avoid-Shift-Improve,” (included in Québec’s Politique de mobilité durable) we certainly need to continue to Improve vehicle and energy technologies, but we must also take serious action to Avoid unecessary trips through better land use planning, urban design and demand management, and Shift trips to low-carbon modes (transit, walking, cycling, shared rides).[10]
Figure 6. Avoiding Clean Congestion: Green tech isn’t enough – we need to drive less.

Source: Green Resilience Strategies, Avoiding Clean Congestion
So what can we do about it?
It’s well known that smart growth and TOD can reduce driving levels. The question is how to accelerate TOD and curtail car-oriented sprawl. Following are some constructive steps to follow.
The Metropolitan Land Use and Development Plan for Montreal (PMAD) has set TOD as a top priority, defining 155 TOD sites to accommodate 40-60% of new housing in the metro region.
We need a TOD implementation action plan to realize the PMAD vision:
Prioritize strategic TOD sites with high potential for accommodating new growth – being careful to avoid disruptions to sensitive habitats and agricultural lands..
Develop station-area development plans that reflect community priorities, market realities and environmental sensitivities. These site plans should include a diversity of public and private development to create healthy, walkable neighbourhoods where people can live, work, shop and play.
Identify catalytic short-term investments to activate those TOD neighbourhoods and shape their growth (e.g., pedestrian and cycle networks, parks).
Leverage the $6.3 billion REM investment to advance TOD. The Réseau express métropolitain presents a tremendous opportunity to accelerate implementation of the PMAD TOD goals and bring about low-carbon, travel-efficient development and affordable housing. That would require determined coordination among provincial (MTQ, MELCC), regional (ARTM, CMM) and municipal agencies, the Caisse de dépôt and private developers. Let’s not squander this opportunity to reshape urban form in Montreal.
Develop a TOD policy framework to foster favourable market conditions for private investment in equitable and sustainable TOD. Advocates and policy leaders have proposed a suite of smart growth measures that will help reduce driving and GHGs:
Land Use
- The Climate Action Network Canada has called for targeted initiatives and incentives for compact, complete communities integrated into federal funding for transit and housing.
- A coalition of municipal leaders and organizations in Quebec recently issued a densification declaration, noting the need for a Quebec-wide policy on land use planning and urbanism to combat sprawl and promote density (l’alliance ARIANE).
- Vivre en Ville has called for creation of a $100 million fund for sustainable development and urbanism, and zero net growth in the conversion of natural and agricultural lands. And their new report Planifier pour le climat, calls for directing new development to areas that are already travel-efficient or have a high potential for GHG reduction (infill and TOD).
- Other provinces have systems of development charges to help pay for infrastructure needs and prevent loss of agricultural land that could be beneficial for Quebec.
- Land use and transportation scenario analyses are important to help metropolitan areas quantify the opportunity costs of business-as-usual sprawl and the GHG, economic and social benefits of smarter, compact growth.
Sustainable Transportation
- Increased funding for public transit and active transportation. Land value capture tools (such as tax increment finance) enable communities to recover and reinvest land value increases resulting from public investment and can be used to support public transit, active transport and affordable housing.
- Vivre en Ville recommends revising funding rules that benefit roads over public transit, and eco-fiscal pricing measures (km driven, roads, parking, fuels) to accelerate modal shift and generate new revenue sources for sustainable transport. They also recommend consideration of a self-financing “fee-bate” program to increase funding for EVs and discourage sales of gas guzzling SUVs.
GHG Targets and Travel Reduction Impact Analysis
California’s Sustainable Communities Program has set GHG reduction targets for metropolitan areas focused on reducing miles driven through land use changes. While the state has limited enforcement power due to municipal autonomy for zoning, the program is yielding positive results. Importantly the program has created a scoring system for tracking the impacts of development decisions on driving and GHGs. Of note, Vivre en Ville’s Planifier pour le climat report calls for regional targets for transportation GHGs in Quebec.
California’s SB743 changes transportation impact analysis, shifting away from car-oriented level-of-service (LOS) standards to a measure of vehicle miles traveled (VMT) that better supports multi-modality and GHG reduction goals.
You can’t manage what you don’t measure. We need to improve travel data collection to better understand of how travel varies across geographies and over time. Reinstating the Canadian Vehicle Survey would be a good start. And “Big Data” sources can shine new light on how, where and how much we travel.
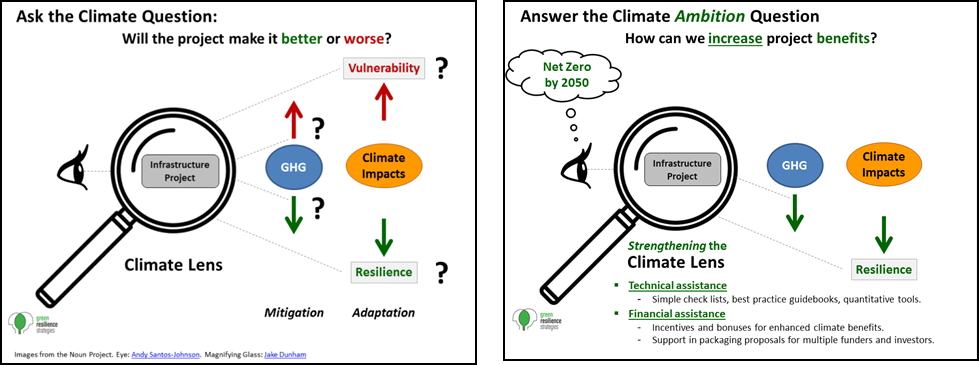
Ask the Climate Question. Are the billions of dollars in federal, provincial, municipal and private infrastructure funding exacerbating sprawl and kilometers driven or promoting low-carbon, walkable TOD?
Infrastructure Canada’s Climate Lens takes a critical first step in assessing GHG and climate adaptation impacts of federal infrastructure investments.
Now is the time to Answer the Climate Ambition Question – How can provinces, territories, municipalities and private investors increase the GHG reduction and resilience benefits of their infrastructure investments?
- Technical assistance is needed in the form of simple check lists, best-practice
guidebooks and quantitative tools.- Financial assistance is needed in terms of direct grants and loans, as well as
support in packaging proposals for multiple funders and investors.
Figure 7. Ask the Climate Question
We look forward to your ideas and to exploring collaboration opportunities on research and policy analysis. info@greenresilience.com
Download the paper.
Endnotes