The Case for Net Cost per Tonne CO2
(Total Return on Investment)
February 12, 2020 │Steve Winkelman
Managers of climate protection funds (e.g., from carbon tax or cap-and-trade revenues) have a responsibility to maximize the GHG reduction benefits of their investments. Cost effectiveness is typically assessed using the dollar-per-tonne ($/t) metric to indicate the amount of CO2 reduced per dollar of investment in a GHG mitigation measure. So, a measure that costs $100 and reduces 100 t of CO2 over its lifetime would have a marginal abatement cost of $1/tCO2. If that same measure reduced energy costs by $100, it would be scored at $0/t, and it could have a negative cost per ton if the cost savings exceeded the initial costs (appropriately discounting future cost savings).
In this blog I aim to convey that a narrow focus on the dollar-per-tonne of an investment in GHG reduction can exclude important GHG emissions and miss the bigger economic picture. I will explain that a Net Cost per Tonne CO2 conveys the total societal return on investment in a GHG mitigation measure and may provide a signal of the likelihood of support for implementation and scale up. Below I provide some more background on the $/t approach, some of its pitfalls and share some thoughts on moving forward.
In the early 2000s the Center for Clean Air Policy supported several US states (starting with NY) in developing their climate change action plans; I led the transportation sector analyses. We scoured national and international sources (including some fabulous work by the Canadian Transportation Climate Change Table) for approaches to quantifying GHG reductions from a variety of transportation measures. (Eventually my colleagues and I collected what we learned in the CCAP Transportation Emissions Guidebook.)
One thing that the climate economists of that era knew to be true was that investing in public transit was a very expensive way to reduce GHGs – due to its high $/t cost. Let’s unpack this a bit.
Calculating $/t is straightforward: divide the costs of the measure (often the net present value) by the GHG savings over the project lifetime to get what I am calling the Direct cost per tonne (Equation 1).
Equation 1. General $/t equation

Let’s consider the example of a new light rail train (LRT) system, taking the lifetime investment in the LRT (infrastructure + O&M) as the numerator of our $/t equation (Equation 2). The next step is to estimate how many new riders would have traveled if the new LRT system did not exist (e.g., drive, bus, walk…), using survey information or modeling data. We sum up of the GHG emissions across all travel modes in what I’ll call the NO-LRT case. We then calculate the GHG emissions from the LRT system. The direct GHG savings are the difference between the NO-LRT and the YES-LRT cases, which becomes the denominator. Dividing the direct the costs by the direct GHG savings results in the Direct cost per tonne for the LRT system.
Equation 2. $/t Equation for LRT System

That’s all well and good, but there are two key problems with this narrow approach: 1) the denominator can dramatically underestimate total GHG savings, and 2) the numerator ignores “co-benefits.”
1. THE DENOMINATOR CAN DRAMATICALLY UNDERESTIMATE GHG SAVINGS.
The direct GHG savings from new LRT riders shifting to transit from more carbon-intensive modes may represent just the tip of the iceberg for GHG mitigation, depending on the land-use and policy contexts of the LRT system. Consider, for example, an LRT station surrounded by a sea of (low-cost) parking; we can expect riders to drive to the station. Whereas for an LRT station that opens into an active neighbourhood with housing, shops, offices, services, parks – and safe and convenient pedestrian crossings – we can expect that more people will walk, bike or bus to the station.
Numerous studies indicate that high-quality public transit tends to leverage additional reductions in vehicle travel and emissions by providing a catalyst for transit-oriented development (e.g., see Gallivan et al, 2015, and Litman, 2004). When destinations are closer together people tend to drive less: more trips are practical by foot or bike, car trips are shorter and densities are more conducive to public transit. In our 2008 book, Growing Cooler: The Evidence on Urban Development & Climate Change, Reid Ewing et al. reviewed the empirical and modeling literatures on how land-use strategies such as smart growth and transit-oriented development (TOD) impact driving. We found driving levels to be 20-40% lower in compact development than in car-oriented development. More recent studies indicate up to 50% savings from compact development (e.g., Ewing & Cervero, 2017; Handy, 2017; Litman, 2019). And these effects play out at the broader metropolitan scale: for example, Houston area residents drive more than twice as many miles per day than people living in the denser, transit-rich New York City / northern New Jersey metropolis.
Therefore, the denominator of the $/t equation misses the major indirect CO2 reductions from improving the travel efficiency (VKT/capita) of transit corridors and attracting new residents and businesses to travel-efficient TOD neighborhoods.
The indirect GHG savings from transit investments can be even more important than the direct savings ─ especially in the longer term.
Thus, to fully understand the GHG savings potential of an investment in public transit, we must consider the current land use context and the real estate market potential around transit stations. Similarly, we must consider policies and investments that support walking and cycling and discourage driving (e.g., parking pricing). (And, yes, that introduces uncertainty, which I discuss below.)
2. THE NUMERATOR IGNORES CO-BENEFITS.
Now, remember those economists I mentioned who were convinced that public transit is a very expensive way to reduce GHGs? From a short-term, project-level, marginal-abatement cost perspective they have a good point.
But here’s the thing I noticed – land owners around certain transit stations were getting rich. Why? Because investment in mass transit improves accessibility to jobs, customers, markets, services, shopping and recreation. People living and working in TOD neighbourhoods can enjoy healthier, safer lives and spend less money on transportation (car ownership, gas, insurance, parking, time in traffic, etc.). And residents and businesses are willing to pay more to locate in accessible neighborhoods where they can live, work, shop and play. And that increases property values. Railroad owners knew this a century ago and profited handsomely. In fact, a number of US street car systems were built to promote access to real estate developments.
So, perhaps the economists couldn’t see the forest for the trees and/or policy makers were asking the wrong questions. We need to zoom out and take a broader systems perspective to see the big picture.
The late, great transportation maven Lee Schipper used to say that “carbon is the co-benefit.” His point was that for most GHG reduction measures, certainly in the transportation sector, the CO2 mitigation benefits tend to pale in comparison to other economic and social benefits such as fuel cost and time savings.
In 2009 my CCAP colleagues and I wrote a paper, “Cost-Effective GHG Reductions through Smart Growth & Improved Transportation Choices,” which was included in my invited testimony to the US Senate Committee on Environment and Public Works. In the paper we provided a number of examples of negative $/t:
TOD in Atlanta, GA: A $200 million investment in the Atlantic Station TOD was projected to reduce 0.6 MtCO2, while generating $30 million per year in local tax revenues -- resulting in net positive economic benefits (after seven years).
Smart Growth in Sacramento, CA: SACOG’s regional “Blueprint” transportation and land use study was projected to reduce infrastructure costs by $9.4 billion and save 7.2 MtCO2. Increased investments in transit of $120 million per year would be more than offset by annual fuel cost savings of $380 million. I calculated the net present value of the increased transit costs, fuel cost savings and avoided infrastructure costs to be about $1.4 billion. Dividing by the cumulative 7.2 MMTCO2 savings yields a net benefit of $198 per ton CO2 saved or -$198/t.
Bicycle Infrastructure in Portland, OR: -$1,664/tCO2 due to fuel and health care cost savings (based on Rails-to-Trails analysis).
The NoMa TOD project in Washington DC cost $120 million for a new Metro station, which was built in 2004. By 2012 the neighbourhood was generating $60 million in annual municipal taxes, and has attracted more than $3 billion in private investment. While I haven’t calculated the CO2 savings from the project, I note that it is located near Union Station in an increasingly walkable, mixed-used neighbourhood, and that residents of Washington DC drive about one third as many miles per day as the regional average (Figure 1). Thus, had the same development gone to more car-oriented areas driving levels could have been three-times higher.
Figure 1. Daily driving in the Washington DC region

In our 2011 book, Growing Wealthier: Smart Growth, Climate Change and Prosperity, Chuck Kooshian and I tried to bridge the gap between project-level and systems-level economic analysis. We documented how application of smart growth principles can:
Increase Return on Investment (e.g., higher retail sales due to better access to customers, greater municipal tax revenues due to increased property values);
Reduce Costs (e.g., household travel expenditures and government infrastructure costs); and
Improve Quality of Life (e.g., better access to jobs and services, better air quality and health, reduced pedestrian fatalities).
The 2014 Global High Shift study by ITDP and UC Davis, concluded that major global investments in clean public transport, walking and cycling and a parallel decrease in infrastructure for cars (roads, parking…) could save $100 trillion through 2050 and reduce 1.7 gigatons (billion) CO2 per year. Assuming annual average cost savings of about $3 trillion per year ($100 T ¸ 35 years), that comes to - $1,681/tCO2. (And the report does not even include the type of ROI and quality of life improvements documented in Growing Wealthier.)
(For more recent documentation of the win-win economic benefits of compact developments I suggest the following studies from Todd Litman (Victoria Transport Policy Institute): Evaluating Public Transit Benefits and Costs and Understanding Smart Growth Savings.)
Net Cost per Tonne CO2
If we now consider the total economic benefits resulting from a GHG mitigation measure and divide that by the total GHG savings (direct + indirect) we get what I’m calling the Net cost per tonne CO2 (Equation 3).
Equation 3: Net Cost per Tonne CO2

Or, we could flip things around and consider the Benefit per tonne CO2 reduced (Equation 4).
Equation 4. Benefit per Tonne CO2

While the examples I provided above focused on urban transportation and development, considering the broader economic and social benefits of GHG mitigation measures is advisable in all sectors for these reasons:
We care about more than just carbon: health, social equity, economic prosperity, resilience, etc. are also critical societal priorities;
Taking a systems perspective can shed light on synergies that can increase GHG savings; and
With multiple benefits we open the possibility for new allies and investors, which can accelerate implementation.
As such, Net Cost per Tonne CO2 conveys the total societal return on investment in a GHG mitigation measure and may provide a signal of the likelihood of support for implementation and scale up.
In Growing Wealthier, we considered how different types of benefits would accrue to a variety of stakeholders: businesses, households and governments. The point wasn’t to find a single $/t number, rather we aimed to highlight opportunities for stakeholders to identify their own self-interest and find their own narrative within the cells of the Growing Wealthier Matrix. Quantifying and communicating the multiple benefits for diverse groups of people can help identify allies, cultivate champions and neutralize opposition to transformative ideas.
Figure 2. Growing Wealthier Matrix
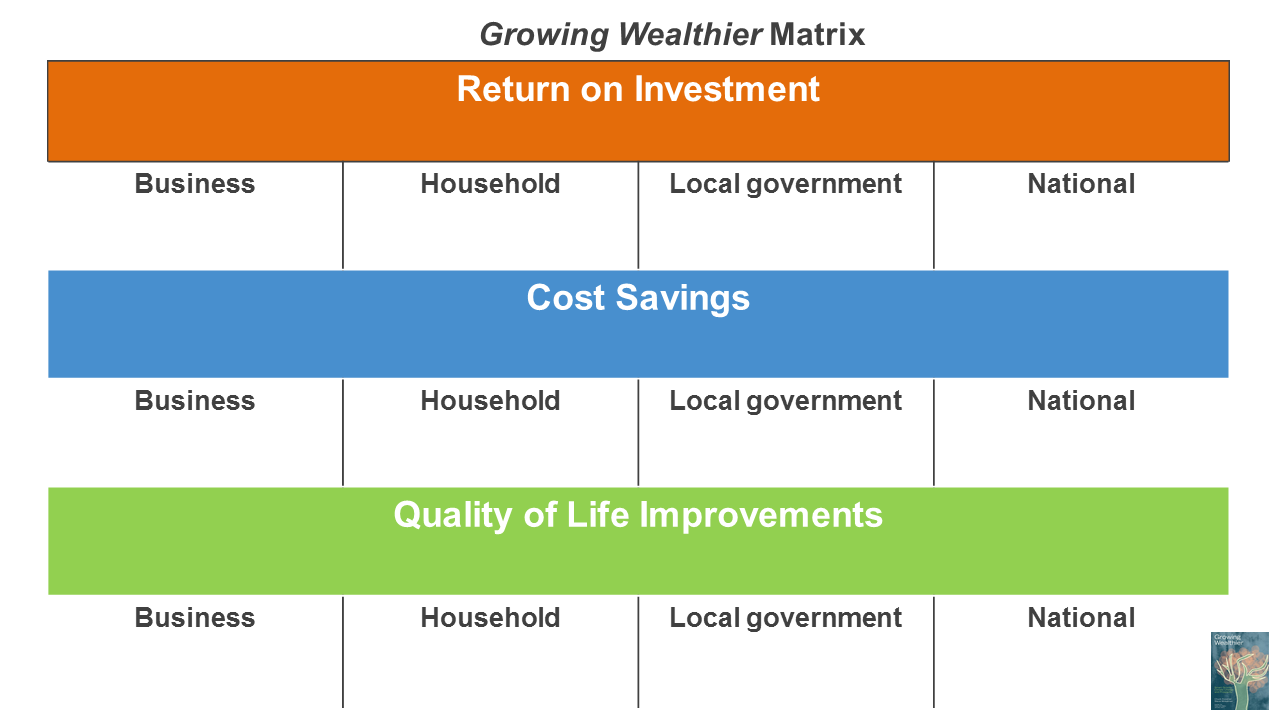
Figure 3. Growing Wealthier Matrix: with examples of smart growth benefits

Apples and Oranges?
But aren’t we just making things more complicated by including all sorts of “soft” and indirect benefits that are hard to quantify? Perhaps. But what’s truly complicated is reducing GHGs quickly enough to limit global warming to 1.5° or 2°C. If we have to be more thoughtful about our climate change expenditures, so be it. We risk losing an artificial sense of precision on the costs of GHG mitigation in exchange for the potential of abundant benefits from transformative change. I’m not saying we shouldn’t take carbon accounting seriously. Au contraire – we must keep careful track of the carbon impacts of all of our policies and investments, not just narrowly-defined GHG mitigation projects.
If we aim to have perfectly consistent $/t numbers that can be reliably added and subtracted, then we can certainly worry about apples and oranges. But let’s not let that get in the way of enjoying a tasty and nutritious fruit salad as we work to decarbonize our economies.
Figure 4. Apples, oranges and then some

Embracing Uncertainty: Progress Over Perfection
In the context of regulatory or market-based approaches to emission reduction (e.g., with tradable permits or offsets) uncertainty in GHG mitigation is anathema because over-estimating savings would result in higher pollution levels. Thus project-level GHG mitigation culture has appropriately put great emphasis on “additionality” (ensuring that emission reductions would not have occurred without the mitigation measure) and avoiding double counting. But I fear that we sometimes put more effort into developing robust emission calculation methodologies than into figuring out how to actually achieve real-world emission reductions – including assessing and communicating socio-economic benefits to bolster implementation and scale-up.
The international climate policy world has evolved from a project-level focus (e.g., in the Clean Development Mechanism) to broader, programmatic and systemic approaches such as NAMAs (nationally appropriate mitigation actions) that center on policy frameworks and finance mechanisms to scale-up GHG mitigation measures across economic sectors and geographies. According to the NAMA Facility, NAMAs are meant to bring transformational change (in this video I explain the paradigm-shifting approach of the Colombia TOD NAMA). As such, we can expect and must accept more uncertainty in projecting GHG reductions. As we put it in a 2010 CCAP paper (led by Adam-Millard Ball):
As we put it in a 2010 CCAP paper (led by Adam-Millard Ball):
Accept uncertainty. There will be considerable uncertainty in modeling emissions reductions and developing baselines, especially for some of the most transformational projects. At least initially, evaluation decisions will need to take account of this uncertainty and focus on funding packages that are directionally correct, i.e., those that reduce emissions, even though the exact volume of reductions may be uncertain.
I’d rather be uncertain about potentially major GHG reductions from ambitious efforts, than be certain about small reductions from narrowly-defined projects.
Scarcity vs. Abundance Mindset
In The 7 Habits of Highly Effective People, Stephen Covey contrasted an “abundance mindset” with a “scarcity mentality.” When we are in an abundance mindset we feel that there are plenty of resources and successes to go around – sharing is seen as an opportunity and not a threat. Whereas from the scarcity mindset we see the world as a zero-sum game – you lose when someone else “wins.” So, yes I think we haven’t seen the forest for the trees and we haven’t been asking all of the right questions.
We have been resigned to make do with the hard-won, but insufficient funding dedicated for climate protection. Instead we must think bigger and ask how can we pool and leverage a broader set of assets to maximize GHG benefits.
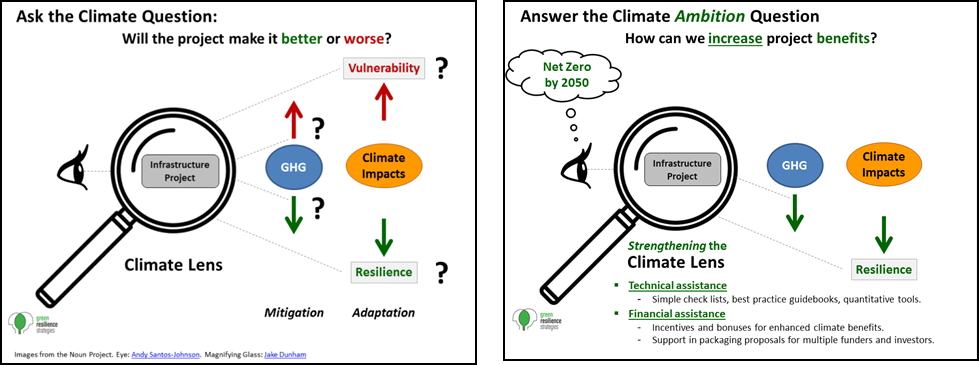
That’s particularly important when we consider climate funding in a broader budgetary and market context. For example, Quebec’s carbon auction raised almost $1 billion for the Fonds Vert in 2019. While extremely impressive and important, that amount represents less than 1% of the $113 billion provincial expenditures in budget year 2019/20, and only 0.25% of Quebec’s annual GDP ($370 billion). When we consider that private expenditures account for 75% of non-residential capital investment in Canada (Figure 5) we have the opportunity for even greater abundance if we Answer the Climate Ambition Question of all major public and private investments, policies, plans and actions (figure 6).
Figure 5. Non-residential Capital Investments in Canada

Figure 6. Ask the Climate Question
(I provide further policy recommendations for advancing TOD and smart growth in my blog on sprawl and GHGs in greater Montreal.)
Are we Measuring the Right Things?
In recent years we’ve gotten much more sophisticated about GHG mitigation methodologies. I call your attention to the 2017 UNFCCC et al. Compendium on GHG Baselines and Monitoring: Passenger and Freight, in which we laid out robust methodologies for assessing GHGs from of a variety of transportation measures. See especially Chapter 2 (led by CCAP’s Chuck Kooshian) on comprehensive urban programs, which reflects the tiered, holistic approach to monitoring and evaluation for the Colombia TOD NAMA: tracking progress, performance, institutional evolution, mobilized finance (public and private), intermediate outcomes and socio-economic impacts — as well as GHG savings.
Figure 7. Holistic Monitoring & Evaluation for the Colombia TOD NAMA

source: wwf-Hill for CCAP, CIUDAT and the NAMA Facility.
I also call your attention to the Climate Investment Funds’ (CIF) new report, Signals of Transformational Change, which considers four dimensions of transformation: relevance, systems, scale and sustainability and a offers framework for tracking how indicators evolve over time [I’ve taken the liberty of re-labeling some of the categories]:
Progress (e.g., program design and implementation)
Process advancements (e.g., policies, budget allocation, new institutions, project pipelines)
Outcomes external to project boundaries
Scale-up
Increasing participation levels (e.g., uptake of incentives, technologies)
Increasing financial flows
Lower concessionality, greater enforcement, copycat efforts
Mainstreaming and Sustainability
GHG mitigation integrated into planning decisions
Long-term, self-sustaining outcomes are materializing.
Moving Intentionally Toward Net Zero
We can no longer afford to nibble around the edges -- we need deep GHG reductions in all sectors. We need to align climate protection actions with broader equity, sustainability, prosperity and resilience goals. We must both reduce emissions and prepare for climate change impacts, while pursuing “Green Resilience” synergies that advance mitigation and adaptation.
In a 2018 blog post, Best bang for our climate bucks: Looking beyond cost per tonne, Julia Langer, CEO of The Atmospheric Fund (TAF), called for a more nuanced and strategic approach to making smart climate investments, including taking into account lifetime carbon impacts, long-term financial benefits, co-benefits and net cost per tonne. And she offered some sage insights on scale-up and transformation. I quote:
Leveraging potential: Ironically, a singular focus on the lowest cost per tonne can actually lead governments to make investments that make little sense. That’s because low cost per tonne actions generally have a strong business case without incentives or subsidies. … If public funding is dedicated to projects with low costs per tonne, it should be done in a manner that leverages and ‘crowds in’ other sources of capital to achieve emissions reductions faster.
Catalyzing potential: Although many emissions reduction measures are not currently low-cost, strategic investment could demonstrate, de-risk and move them to scale. In short: it’s worth investing in what may not be cost-effective today, but has the potential to be down the road.
Of note, TAF’s successful model inspired the LC3 (Low Carbon Cities Canada) initiative to accelerate and scale-up urban climate action through a network of seven metropolitan centres across Canada. LC3 is funded with a $183 million Federal investment as part of a $350 million investment in the Federation of Canadian Municipalities’ Green Municipal Fund. Imitation is the best form of flattery -- and a strong signal of transformational change!
I am pleased to report that two major sustainability organizations in Quebec have endorsed my call for a net-cost-per-tonne approach in their comments on Quebec’s new climate change law (PL44):
Vivre en Ville : Avoid the cost-per-tonne trap.
Éviter le piège du coût à la tonne et mieux tenir compte des cobénéfices. Mettre en place des indicateurs de performance plus complets que le coût à la tonne pour mieux tenir compte des retombées globales des mesures financées, comme le coût net à la tonne.Équiterre : The $/t approach greatly underestimates systemic benefits.
L’approche « $/t éq. CO2 réduite » sous-évalue grandement les bénéfices structurants des investissements dans la mobilité durable. À cet effet, Équiterre est d’avis que des indicateurs de performance reflétant les retombées globales des mesures financées comme le coût net à la tonne, soient mis en place.
As always, I welcome your feedback and input (info@greenresilience.com). Let’s work together to better consider, quantify and communicate the multiple benefits of GHG mitigation measures in order to magnify and accelerate their impacts. Cultivating an abundance mindset by moving from $/t to net-cost-per-tonne analysis will help us to see the forest and eat our fruit salad too (but it won’t cure my tendency to make puns and mix metaphors J).
Download the blog post.