Economic, Social & Environmental Benefits of Smart Growth
Affordability, Health, Prosperity, Sustainability, Resilience
May 15, 2020 │Steve Winkelman
Before deciding to buy a particular house you do your homework on the state of repair, the heating costs, property taxes, closing fees, insurance, etc. Certainly you know the asking price! Smart investment requires assessment of full lifecycle costs: upfront capital outlays, expected future capital expenditures and operating expenses.
What we build – where and how – has a tremendous impact on economic prosperity, equity, health, quality of life and environmental sustainability. But too often municipal officials don’t know the price tag of planning decisions or the opportunity costs of status quo trends vs. more compact development. City governments must do their due diligence and assess the full costs and benefits of their decisions on policies, plans and major infrastructure expenditures — including considering future risks and liabilities. Ideally they should aim to minimize total costs and maximize total benefits for diverse stakeholders.

What are the costs and benefits of status quo sprawl vs. smart growth?
As cities and metropolitan regions plan their future growth it is critical that they assess the full range of economic, social and environmental costs and benefits of their land use development plans.
They’ll never have perfect information, but should conduct sufficient assessment to make well-informed decisions based on best-available data and up-to-date analytical techniques. A fundamental best practice is to develop a few scenarios – e.g., status quo, compact development / smart growth – and assess the total costs and benefits of each. There are a wide variety of scenario analysis tools, land use and transportation models to conduct such assessments (such as the Urban Footprint model), with a range of capabilities for quantifying impacts (household costs, municipal costs, travel, GHG emissions, etc.). There is also a robust and growing literature documenting the economic, environmental and social impacts of urban design and land development patterns.
In this blog I frame key factors that should be analyzed — Affordability, Health, Prosperity, Sustainability and Resilience — and provide some examples of each. I draw upon a variety of sources including my 2011 book with Chuck Kooshian, Growing Wealthier: Smart Growth, Climate Change and Prosperity and Todd Litman’s comprehensive ouevre. In Growing Wealthier we documented how application of smart growth principles can:
Increase Return on Investment (e.g., higher retail sales due to better access to customers, greater municipal tax revenues due to increased property values);
Reduce Costs (e.g., household travel expenditures and government infrastructure costs); and
Improve Quality of Life (e.g., better access to jobs and services, better air quality and health, reduced pedestrian fatalities).
(Note that many names are used for describing more compact development patterns including smart growth, transit-oriented development (TOD), new urbanism, 15-minute communities, etc. These approaches include elements such as pedestrian-friendly design, higher density, mixed land uses, active transportation, “complete” streets and regional travel accessibility through high-quality public transport.)
AFFORDABILITY
Transportation Costs. People living in compact communities tend to drive less and own fewer vehicles and therefore spend less money on car ownership, gasoline, insurance and parking — and spend less time stuck in traffic. While they may spend more on public transit they enjoy a net cost savings and increased disposable income — especially for low income households. A California study found that households in central and transit-oriented areas spend 20-70% less on transportation than suburban households. The improved accessibility and travel choices afforded by compact development can enable a household to get by with one car instead of two — saving Canadian’s $8,000 to $15,000 per year.
Housing + Transportation Costs. Housing affordability is seen as a key driver of suburban sprawl. Many people “drive until they qualify” for a mortgage. But savings in housing costs can be offset by transportation costs which can be 30% - 300% higher in sprawling areas than in central- and transit-oriented areas (per Litman). The Center for Neighborhood Technology’s Housing + Transportation Affordability Index calculates housing and transportation costs for specific locations, illuminating the affordability benefits of travel-efficient locations.
Housing Choice. In the Greater Toronto Area, 81% of home buyers would prefer to live in walkable, transit-friendly neighbourhoods, but they can’t afford to (RBC & Pembina, 2014). From a basic economics perspective, the market under-supplies walkable, transit-oriented development: when demand is high and supply is low, price goes up (Levine & Frank , 2007). And this pent-up demand is growing (RBC & Pembina, Smart Growth America 2019), with walkable TOD housing commanding higher prices (Cortright 2009) – making them less affordable.
HEALTH
Public Health Care Costs. A study for the San Francisco Bay Area found that reductions in driving due to smart growth strategies could reduce health care costs by $140 million USD by 2035.
Air Quality. Each year air pollution kills some 7 million around the world. Reducing driving reduces air pollution and associated illnesses and deaths.
Physical Activity. Exercise gets built into daily activities when it’s safe and convenient to walk and bicycle. People walk more in compact, intentionally walkable communities, resulting in greater overall health, decreased obesity, longer life expectancy and improved mental health (for more detail see see Growing Wealthier and Litman).
Reduced traffic fatalities. Compact communities have lower traffic fatality rates than sprawling ones (Yeo et al 2015). (Injuries and deaths can be reduced even further through pedestrian-oriented design and other Vision Zero strategies.) For example, in the transit-oriented New York City region there were 1.6 annual pedestrian fatalities per 100,000 people, vs. 3.1 in the more car-oriented Tampa, FL region.
Urban Heat Island. Smaller building footprints and good urban design that expands green infrastructure can mitigate the urban heat island effect.
ECONOMIC PROSPERITY
jobs.
Smart growth and TOD can improve jobs/housing balance and thus employee access to jobs.
Analysis of the 2009 stimulus spending in the US determined that investment in public transit created almost twice as many jobs as the same investment in highway projects.
Household transportation costs. As noted above households in compact areas spend 20-70% less on transportation.
Infrastructure costs. Compact development results in lower overall infrastructure costs than sprawling development patterns as more people can be served by the same infrastructure. And there is certainly less need for paving roads and parking lots. Those higher costs stress municipal budgets and get passed on to taxpayers.
London, Ontario found that sprawling development would cost $2.7 billion more than a more compact growth scenario — 180% higher.
Calgary found that that a denser growth could reduce capital costs by $11 billion.
Sacramento, California calculated that their smart-growth scenario cost $9.4 billion less than conventional development, a savings of about 20% and about $12,000 per household.
Municipal Service Costs
That same Sacramento study found that increased annual investments in transit operating costs of $120 million would be more than offset by annual fuel cost savings of $650 million. (It is noteworthy that while the fuel cost savings would be a benefit to private individuals, the transit operating costs accrue to the government. Thus, households could potentially face higher taxes to cover the increased transit operation, but those would be more than offset by infrastructure cost savings.)
A study in Halifax found that households in denser urban locations cost 40-60% less to service than low-density suburban areas (savings of $1,500 to $2,200 per household).
The City of Calgary’s cost-based development fees are significantly higher in more remote, low-density locations (cited in Litman).
Municipal Tax Revenues
Fiscal impact analysis for Madison Wisconsin indicated 55% higher net benefits (increased tax revenues minus increased municipal service costs) for compact development than low density.
A study in Sarasota, Florida compared the economic performance of an urban and a suburban residential development of about 350 dwelling units each. The first was downtown on about 3.5 acres. The second covered more than 30 acres in the suburbs near a freeway interchange. The anticipated property tax revenues from the downtown project were over 8 times higher than the suburban development. Although the downtown costs were higher per acre, the total infrastructure cost to the city of the downtown project was about half of the suburban project’s. Public Interest Projects, Inc. calculated that the annual return on infrastructure investment for the city was 35% on the downtown development, and only 2% for the suburban development.
The NoMa TOD project in Washington DC cost $120 million for a new Metro station, which was built in 2004. By 2012 the neighbourhood was generating $60 million in annual municipal taxes. (A full analysis requires consideration of any increased municipal service costs from the new development, as well as comparison of the service costs that would have arisen had the development been in a more remote suburban location.)
Public investments in public transit, pedestrian infrastructure and urban trees can increase private property values and therefore municipal revenues. Land value capture tools (such as tax increment finance) enable communities to recover and reinvest land value increases resulting from public investment and can be used to support public transit, active transport and affordable housing (to mitigate gentrification).
Attracted Private Investment.
That same NoMa TOD project in Washington DC has attracted more than $3 billion in private investment since the initial $120 million investment.
Similarly, a $100 million investment in the Portland Oregon helped attract $3.5 billion in private investments adjacent to the line.
Retail Sales.
London, UK: High street pedestrians spend 40% more than drivers.
NYC: Retail sales were 24% higher on streets with protected bike lanes.
Dallas, Texas: Downtown retail sales increased 33% in the first year of operation of the light rail system, while retail sales in the rest of the city grew by only 3 percent.
In Growing Wealthier, we considered how different types of benefits would accrue to a variety of stakeholders: businesses, households and governments. I recommend such a matrix-based approach to allow different stakeholders to identify their own self-interest and to aid public officials in better understanding synergies and trade-offs. The California Air Resources Board further refined households into several categories: homeowners, prospective buyers, renters and low-income in a 2016 study on the economic impacts of smart growth.
Figure 1. Growing Wealthier Matrix
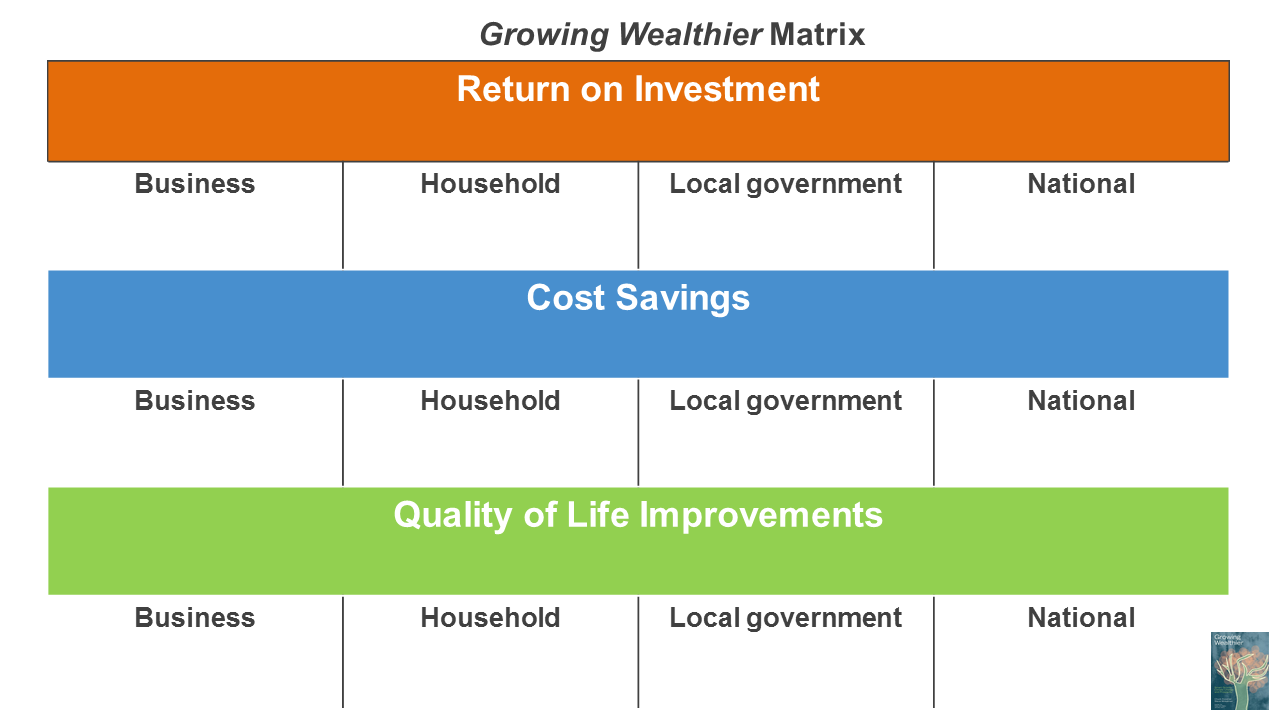
Figure 2. Growing Wealthier Matrix: with examples of smart growth benefits

SUSTAINABILITY
Driving: When destinations are closer together people tend to drive less: more trips are practical by foot or bike, car trips are shorter and densities are more conducive to public transit. There is a vast academic literature on how compact development impact levels of driving including (e.g., Ewing et al, [including me] 2008; Ewing & Cervero, 2017; Handy, 2017; Litman, 2019); the bottom line is that smart growth can reduce driving by 20-50% compared to sprawling car-oriented development.
Emissions: Such a reduction in driving yields a proportional reduction in greenhouse gas (GHG) emissions and air pollution. Due to the host of economic and social benefits summarized above, compact development can often yield a net benefit, or negative net cost per ton CO2. For more information on why electric vehicles alone won’t save the day, please see my video blog: Avoiding Clean Congestion.
Land Conversion. Focusing new development in existing built-up areas protects agriculture lands and preserves natural habitat and open spaces. Smart Growth requires 50% less land for cars (roads and parking) than sprawling development.
Water. Less impervious area means less storm water runoff and associated water pollution (e.g., 74% less at densities of 8 units/acre vs 1/acre), greater benefits from green infrastructure and 25% lower water demand (EPA, 2006).
RESILIENCE
Walkable communities with multiple travel modes and networks are also more resilient to shocks and disruptions.
Senior citizens can better age-in-place when services and shops are close by.

It is important to note that density alone — without community engagement, good physical design, mix of land uses, high quality public transit and public-private collaboration — can exacerbate social and environmental problems, such as through gentrification, traffic jams and increased impervious surfaces. Smart growth is truly smart when it integrates the multiple principles of smart growth to realize multiple benefits: affordability, health, prosperity, sustainability and resilience.
Some references for further reading:
Costs of Sprawl (Ewing and Hamidi, 2017)
Growing Wealthier: Smart Growth, Climate Change and American Prosperity (Kooshian & Winkelman, 2011)
Building Better Budgets: A National Examination of the Fiscal Benefits of Smart Growth Development (Smart Growth America, 2013)
Understanding Smart Growth Savings (Litman, updated 2020)
The High Costs of Sprawl (Environmental Defence, 2013)
The Urban Footprint tool.
America's Urban Future: Lessons from North of the Border (Tomalty and Mallach, 2015)
You may also be interested in my blog series exploring how lessons from the response to the coronavirus pandemic might help accelerate climate action. 1) We Pressed Pause. What’s Next? 2) Mobilizing against COVID-19 (by staying put), 3) Think Globally, Produce (& Reduce ) Locally, 4) Prepare and Prevent, 5) Green Reboot?
